What you need:
- Your Nature Adventure Book or blank paper
- Art materials: pens, markers, colored pencils, old magazines, tape or glue.
Directions:
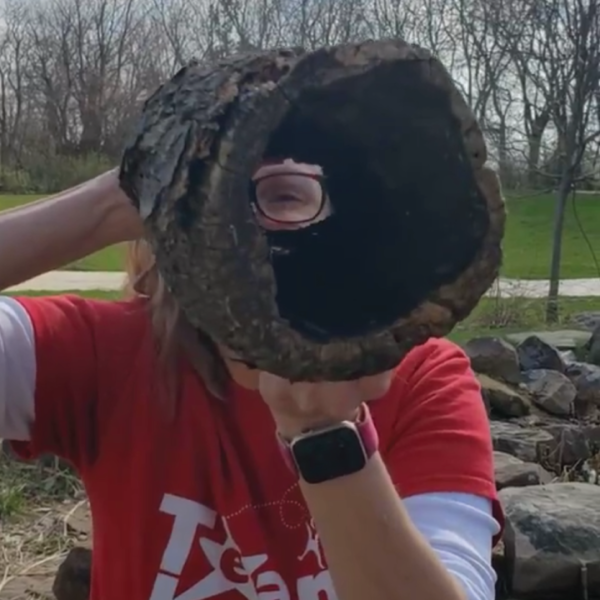
Look under a rock, inside a log, up a tree, or near a water spot! If you are wild about mini beasts, keep your eyes open! Which mini beasts have you seen at the Discovery Center? Your neighborhood? In your own backyard? Don’t forget to record the date, location, time of day, and a weather report in your journal. There are a million, zillion ways to spot a mini beast! Here are a few of our favorites:
- Find and collect (collect mini beasts with adult supervision and permission)
- Find and check (make a list: how many different mini beasts can you find?)
- Find and sketch
- Can you find these mini beasts?
- Ladybug
- Butterfly
- Moth
- Beetle
- Spider
- Snake
- Worm
- Dragonfly
- Ant
- Fly
- Caterpillar
- Slug
- Bee
- Snail
- Centipede
- Rolly Polly
- Wasp
- STINK BUG!
- Play I Spy. Camera phones make this game fun and easy. Take a picture of a mini beast that is...
- Fuzzy
- Brown
- Hairy
- Soft
- Smooth
- Bright
- Beautiful (to you!)
- Long
- Segmented
- Stinky
- Quick
- Slow
- Slimey
- Spiky
How to expand it:
- When you get home from your wonder walk, pull out your art materials and make a pie chart, bar chart, graph, or map of your observations. Compare your current data with past data you have collected. Did you see more mini beasts on a cloudy day or a sunny day? Did you see more creatures in the morning or in the afternoon? Do you feel more creative on a warm day or a cold one? Does sunshine make you feel more inspired to draw or paint in your journal?
- Create a memory. How will your children remember the time you spend together? What will they tell their children? Offer a stress-free zone. Ask, “Where is your favorite outdoor, happy place?” Start a discussion: I wonder if...I noticed that...What do you think of...How do you feel...
- Are you comfortable in the great outdoors? Jump out of your comfort zone and increase your confidence level. Nature will not judge you as you venture forth. Acceptable risks are appropriate for growth. Climb a tree, touch a bug, get muddy. Learn at your own pace, but don’t forget to play!

What Kids Learn
- Exposure to soil lessens anxiety in children.
- Exposure to nature increases active behaviors and decreases reactive behaviors in children. Many children experience a change in emotional states when they get to take a walk outside.
- Natural beauty is an inspiration for artists and scientists. The Fibonacci sequence appears in nature because it represents structures and sequences that model physical reality. We see it in the spiral patterns of certain flowers because it inherently models a form of spiral. Take a closer look at a seashell or a pinecone!
- Sensory play that lets children touch, squeeze, smell and feel helps build connections in the brain.
- Risky play is an important kind of play where children acquire better motor control and learn what is dangerous and what isn’t. Acceptable risk is finding a balance between allowing children to explore and take risks in their play while also avoiding serious injury. Children will be better equipped to manage challenging and risky situations that they will meet both in childhood and later in life. So, it’s okay to let them get dirty!
- Vocabulary:
- Data: facts, statistics and observations collected together for research. Other words to use: details, specifics, information, proof, documentation.
- A bar graph (also known as a bar chart or bar diagram) is a visual tool that uses bars to compare data among categories. A bar graph may run horizontally or vertically. The graph represents categories on one axis and a discrete value in the other. The goal is to show the relationship between the horizontal and vertical axes.
- A pie graph (also known as a pie chart or pie diagram) is a visual tool that uses slices of a pie to compare data among categories. A pie graph is a circle divided up into sections each representing a portion of data. The goal is to show the relationship and proportionate size of each category that you are comparing.

